The Economics of Campgrounds & RV Parks
A primer on supply, demand, revenue models, and operating expenses.
Estimated time to read: 7 minutes
TL;DR:
Supply - there are 2.1MM campsites across 27k campgrounds, including both public and private campgrounds. Private campgrounds serve RVers and public campgrounds focus more on tenters.
Demand - 58 million households went camping in 2022. 12 million households own RVs. That translates to nearly 332 million “camper nights” by camping households.
Revenue models - Campsites are rented by the night, week, month, season, and year.
Operating expenses - Transient campgrounds with shorter stays are more expensive to run.
1. Supply
There are broadly two different types of campgrounds: public and private.
Public campgrounds, on average, are typically known for their beautiful, remote, natural settings, but they also often have neglected facilities and amenities and lack services.
On average, private campgrounds can’t compete with the best public campgrounds regarding natural beauty. However, they typically offer nicer, cleaner facilities and better infrastructure, amenities and services than their public counterparts.
The Recreational Vehicle Industry Association (RVIA) conducted a comprehensive study on public and private campground supply. It is the most complete set of data I have found on the subject, includes data through 2020, and is the basis for my analysis.
Public campgrounds
There are public campgrounds managed by virtually every level of government.
At the state level, there are campgrounds within State Park and State Forest systems across all 50 States.
Federal agencies that operate campgrounds include the National Park Service, U.S. Forest Service, U.S. Army Corps of Engineers, Bureau of Land Management, Bureau of Reclamation, U.S. Fish and Wildlife Service, and the Tennessee Valley Authority.
Beyond state and federal agencies, public campgrounds are operated by cities, counties, municipal authorities, and utility providers.
As you can see in the pie chart below, campsite inventory is roughly equal between federal, state, and municipal agencies.
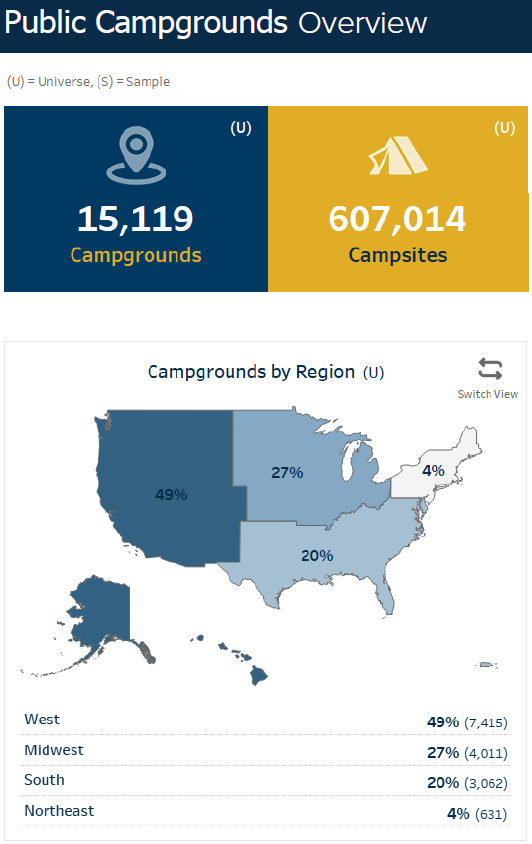
The chart and map below illustrate total public campground and campsite supply by region.
Public campgrounds are heavily geared towards tent camping, as you can see in the graphic below.
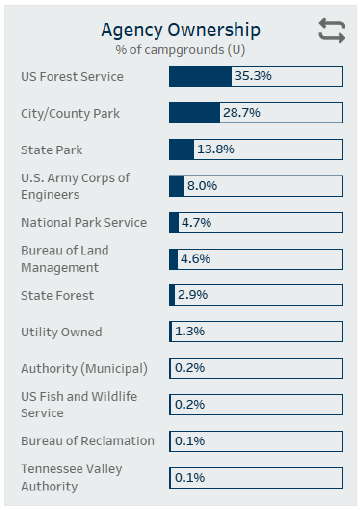
The U.S. Forest Service is the top operator by number of campgrounds, and the chart below provides further detail.
The report also breaks down RV campsite inventory vs. non-RV site inventory. Non-RV site inventory includes tents, cabins, yurts, and other types of lodging.
Within public campgrounds, only ~43.6% of campsites are RV sites.
For further detail on and analysis of public campground supply, check out the report at the link: RV Industry Association Campground Industry Market Analysis Report.
Private Campgrounds
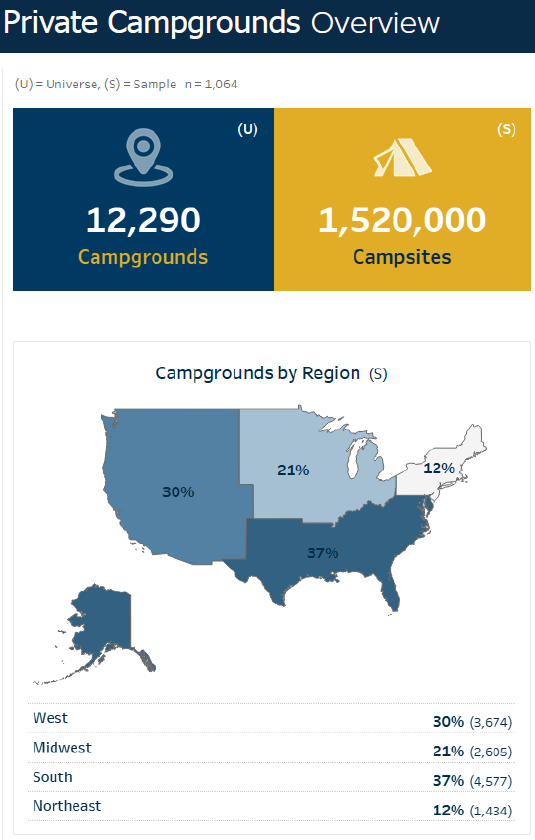
While there are fewer private campgrounds than public, there are more than 2.5x as many private campsites than public.
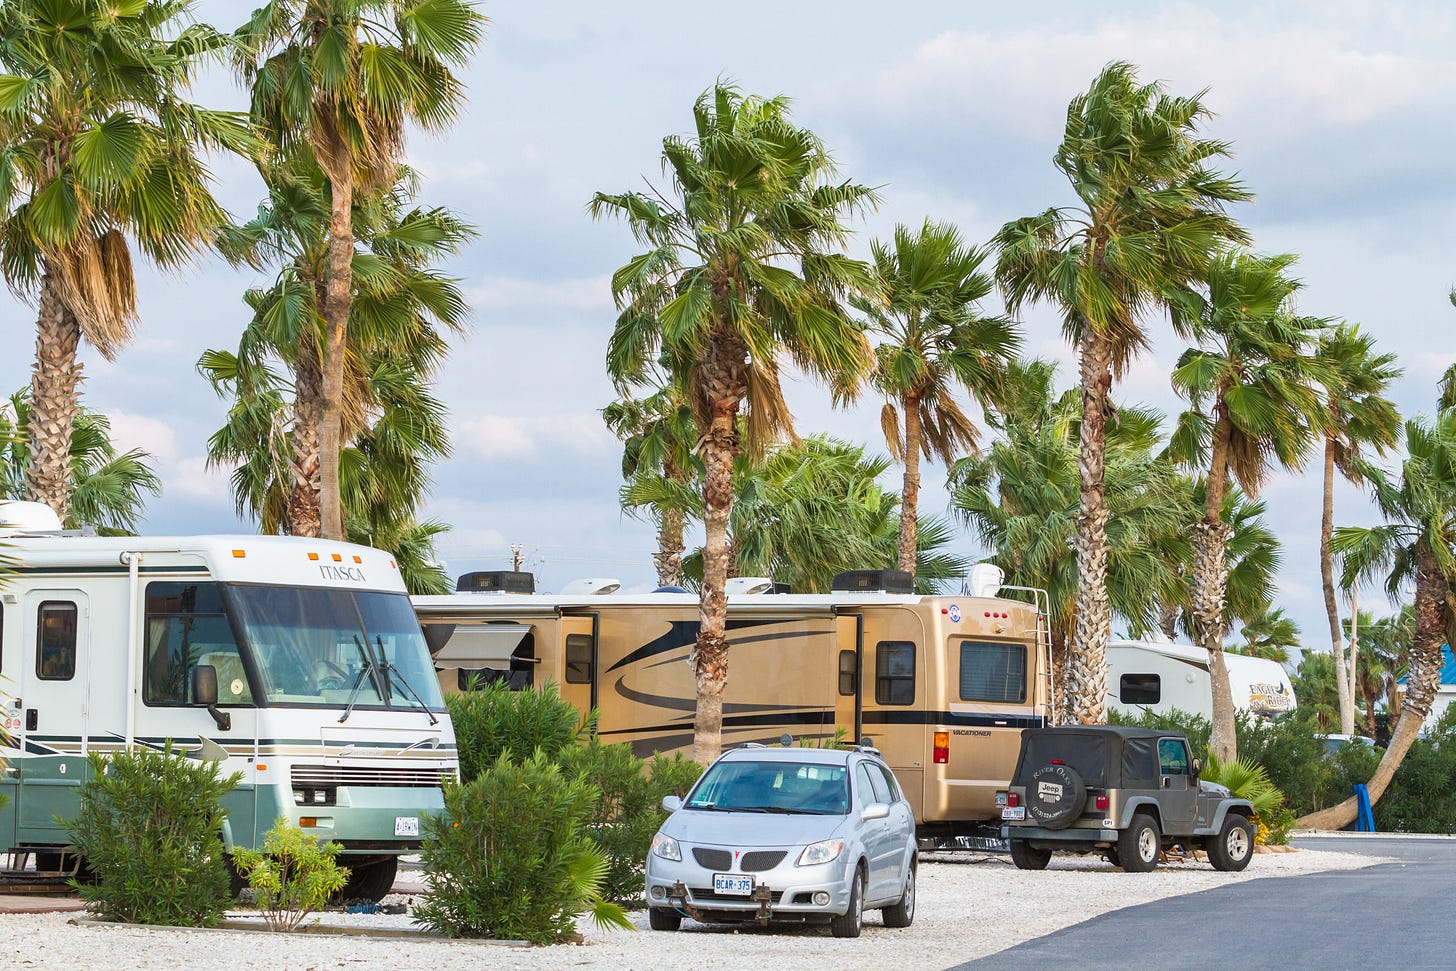
Among private campgrounds, the focus is clearly on serving the RV camper market.
Comparison
The biggest differences between public and private campground offerings are:
Quantity of RV sites vs. non-RV sites (tents, cabins, yurts, etc.)
Amenities at the campgrounds
Types of RV hookups
The charts below illustrate exactly these points:
2. Demand
When I think about the demand for campsites, I think about 5 things and how they’re trending:
How many households go camping (RVing, tenting & glamping)?
How often do these camping households go camping and for how long?
What type of campsite is their preference?
How many households own RVs?
How many people live in RVs full-time?
Kampgrounds of America, Inc. (KOA) puts out fantastic research reports, and their North American Camping & Outdoor Hospitality Report 2023, along with data from RVIA, are the basis for my analysis of camping demand.
How many households go camping?
KOA found that over 58 million households went camping in 2022.
How often do they go camping and for how long?
In 2022, KOA found that 48% of campers went camping 3+ times, while 29% went 2 times, and 23% went once.
KOA found that this translated to an average number of 9.3 camping nights for US camping households in 2022.
What types of camping/campsites do they prefer?
KOA reports that the majority of camping households from 2018-2022 preferred tent camping and that half of those tent camping households would choose to camp in RVs or cabins if money was no factor.
How many households own RVs?
According to KOA, nearly 12 million households owned RVs in 2022.
How many people live in RVs full-time?
A 2018 article by The Washington Post claims that 1 million Americans live in RVs full-time. The Post cites RVIA as its source, but I was unable to locate that document.
Using an average family of 3 people per full-time RVing family translates to around 333,000 RV sites occupied by full-timers, or about 20% of all RV site inventory and 16% of all campsite inventory if we assume that all full-time RVers are residing in a campsite located within a public or private campground.
What does it all mean & how do we express demand?
RVIA took much of the data discussed above and expresses it in the table below as an analysis of “camper nights” and “site nights”.
“Camper nights” = total number of nights campers went camping.
“Site nights” = total number of sites available multiplied by the total number of nights available.
3. Revenue models
Every campground has a unique business model. Campgrounds generate revenue from bookings, services, activities, store sales, and any other revenue stream a creative owner can dream up. That being said, individual campsites simply generate revenue from camping reservations, which generally only vary based on length of stay.
The mix of length of stays across an entire campground are a large part of what dictates how the campground operates (more on that under 4. Operating Expenses).
Campsites are typically rented by the:
Night
Week
Month
Season
Year
Membership (we’ll cover this more in a future newsletter)
Campgrounds just off the interstate typically focus on nightly rentals, as their customers typically stop off for a break on the way to their ultimate destination.
Camping resorts will often have a mix of all of the above.
Seasonal site rentals are popular among parks in the northern states that close for the winter and “snowbird” parks in the southern states that welcome campers who spend the winter months in warmer weather.
Similarly, annual sites are popular among campgrounds that benefit from mild weather year-round.
In general, seasonal and annual sites typically appeal to families and retirees who prefer the convenience of camping in one place vs. the challenges of constantly setting up and breaking down their campsites every few nights.
So, how much revenue do campgrounds generate?
This varies widely, but there is some good data out there.
KOA is probably the most representative portfolio of campgrounds when analyzing revenue, given its nearly 500 locations of varying size and quality. Future newsletter editions will dive deeper into its and other operator’s portfolios.
I estimate their franchisee portfolio to generate around $7,000 in reservation revenue per site.
Sun Communities’ (SUI) resort-style RV portfolio averages closer to $10,000 in reservation revenue per site.
Equity Lifestyle Properties’ resort-style RV portfolio averages around $5,000 in reservation revenue per site.
4. Operating expenses
This also varies widely, and we’ll look at the same operators to start to build some context.
In general, while they generate more revenue, “transient” campgrounds with shorter stays require more labor and more frequent repairs and maintenance to operate, so they are also more expensive to operate.
KOA focuses on transient, short-term rentals, and reports some of the higher operating expenses in the industry, at ~70% of gross revenue.
SUI focuses on annual rentals, and reports some of the industry's lowest operating expenses, at ~46.5% of gross revenue.
This data can be found in the SUI annual reports and the KOA Franchise Disclosure Documents.
We’ll dive deeper into expense categories in a future newsletter!
That does it for this week! Stay tuned for deep dives into the portfolios of top outdoor hospitality operators in the coming weeks.
Thanks so much for reading!


